

Click here to start using Spatial Climate Analysis
Spatial Climate Analysis is HPRCC’s latest way to explore data from the Applied Climate Information System (ACIS)! The web application offers several pathways for users to analyze data from ACIS stations and grid points, while providing an easy to use map interface.
Let’s take a closer look at the tool!
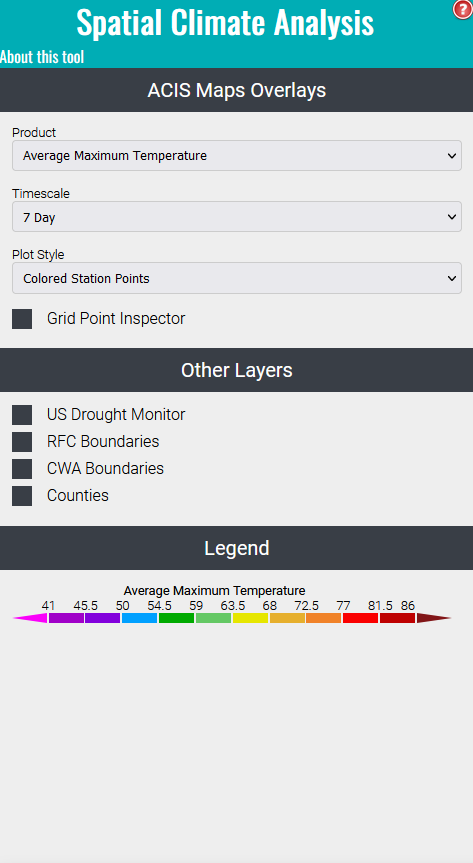
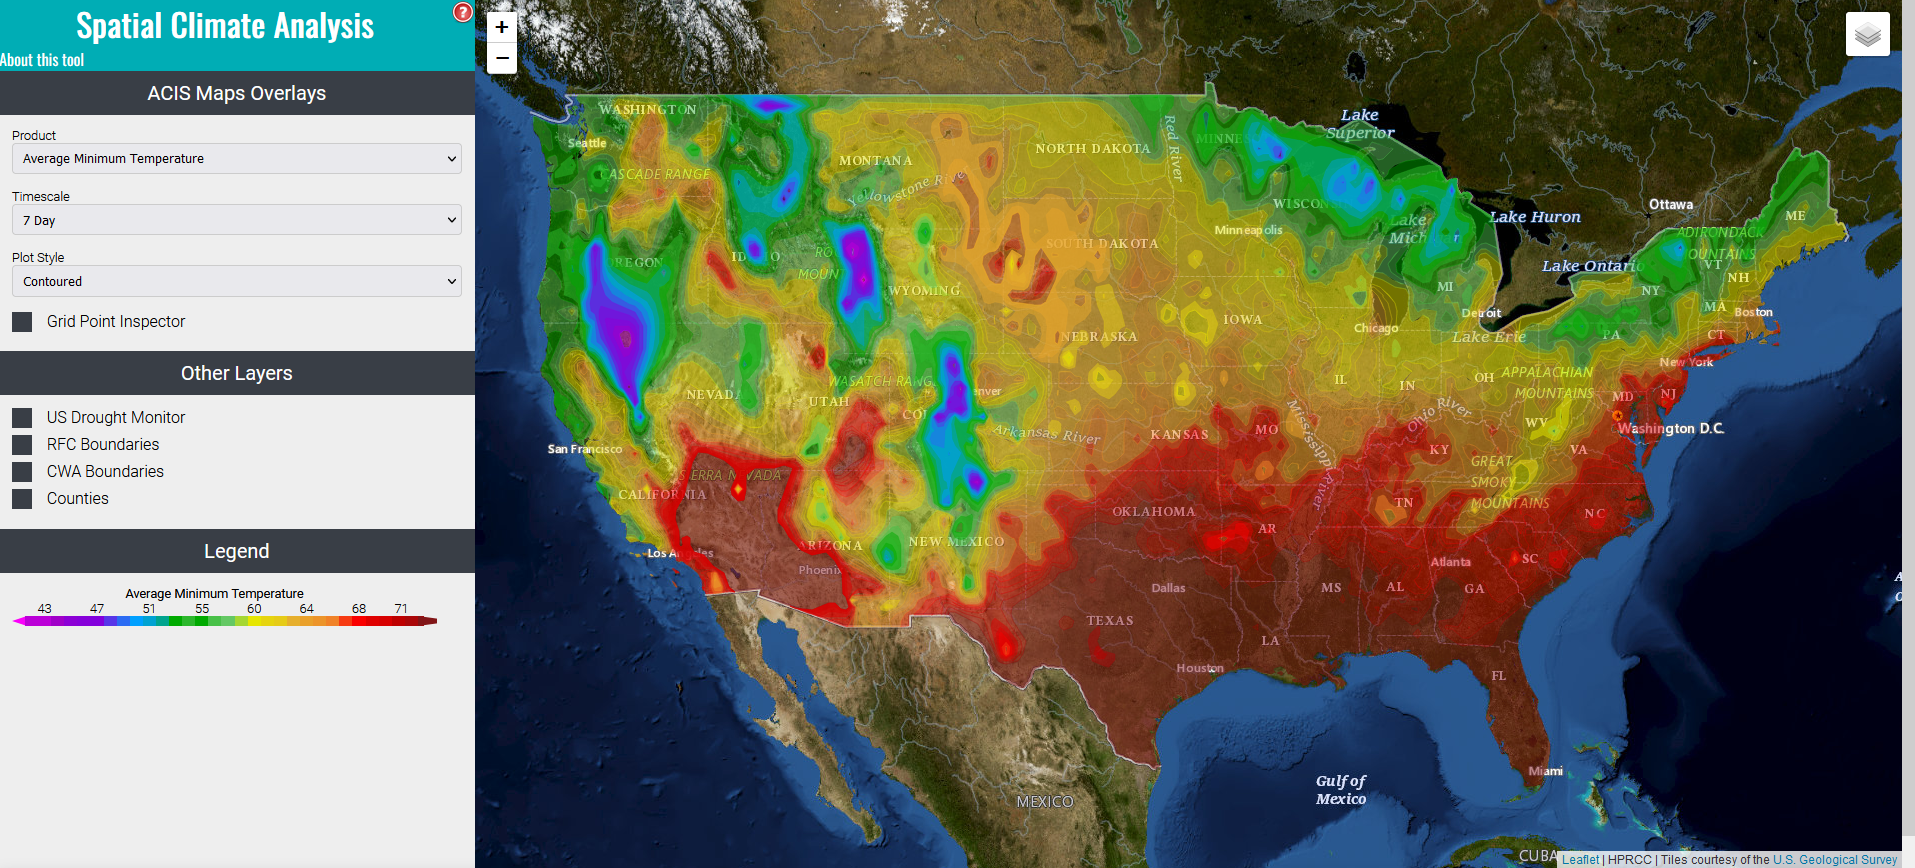
On the left side of the screen is a panel that lets you customize the map, and access different tools. The Product, Timescale, and Plot Style options change the ACIS data being displayed on the map. The Grid Point Inspector checkbox will enable the selection crosshair for analyzing grid points.
The Other Layers section contains other overlays which may be useful. The county overlay will only work when the map is zoomed in enough!
Any overlays that have been selected will have a legend entry added in the legend section.
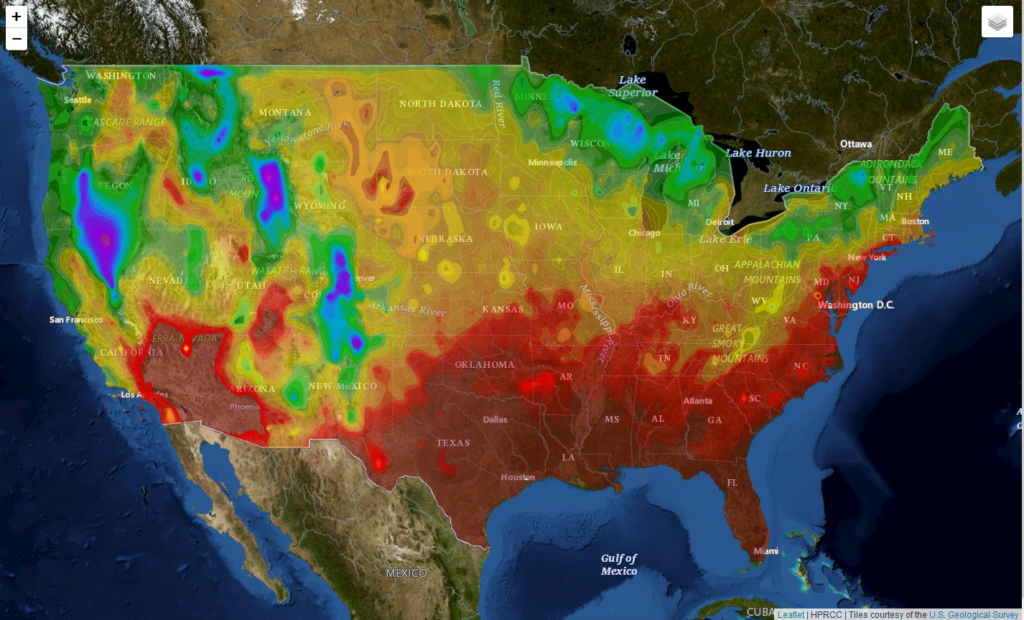
The map panel displays all information selected in the left sidebar. You can click and drag to pan the map, or use the mouse scroll wheel to zoom in or out. The button at the upper right of the map will allow you to change the map in the background!
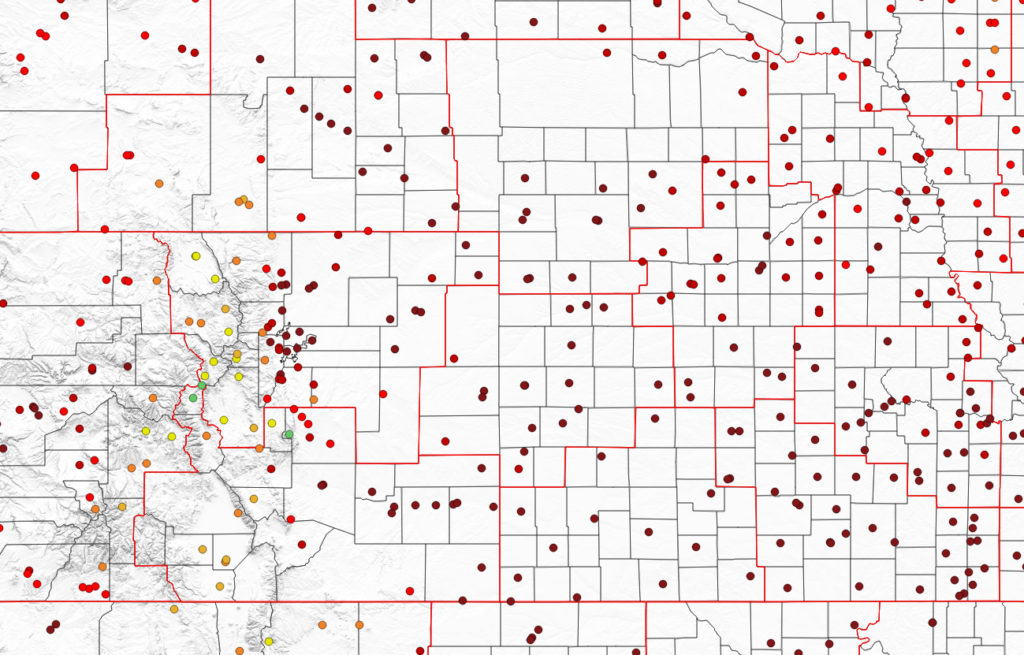
Hover over station points to view their values, or click them to open the station in the Station Data Explorer. There, you can create linkable graphs with the station data.

Enabling the Grid Point Inspector will change your cursor in the map to a crosshair. Click any location of interest to open the Grid Point Inspector!
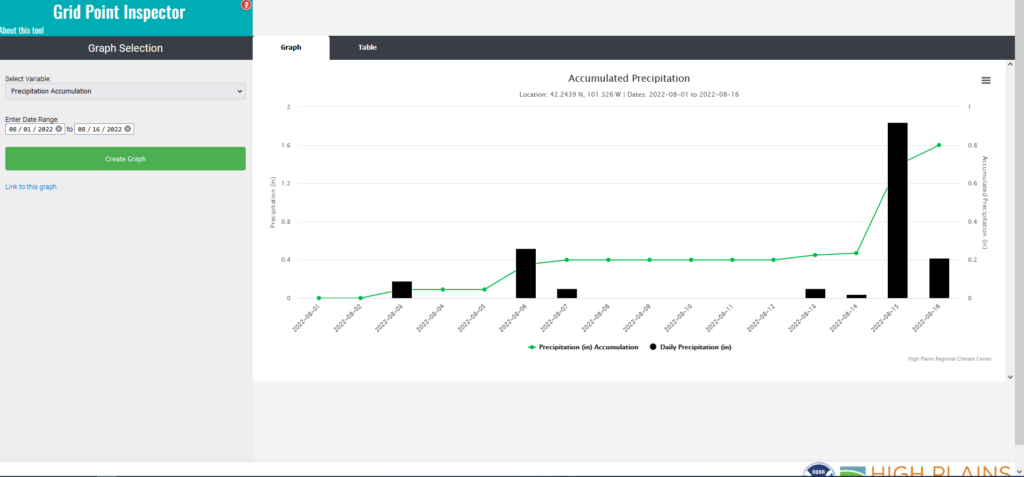
In the Grid Point Inspector, you can create linkable graphs for any grid location in the contiguous U.S.!
As always, feel free to use the Contact Us page to ask questions or tell us how you are using HPRCC tools. You can also find us on Twitter @HPClimateCenter !