The Water Deficit Trends application has received a large update! A number of new features have been added to improve the usability and user experience.
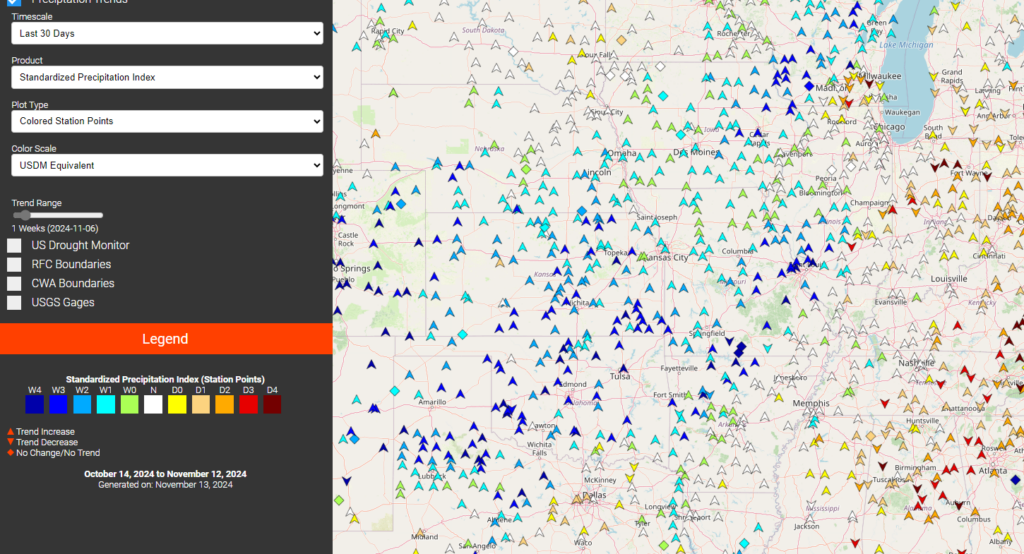
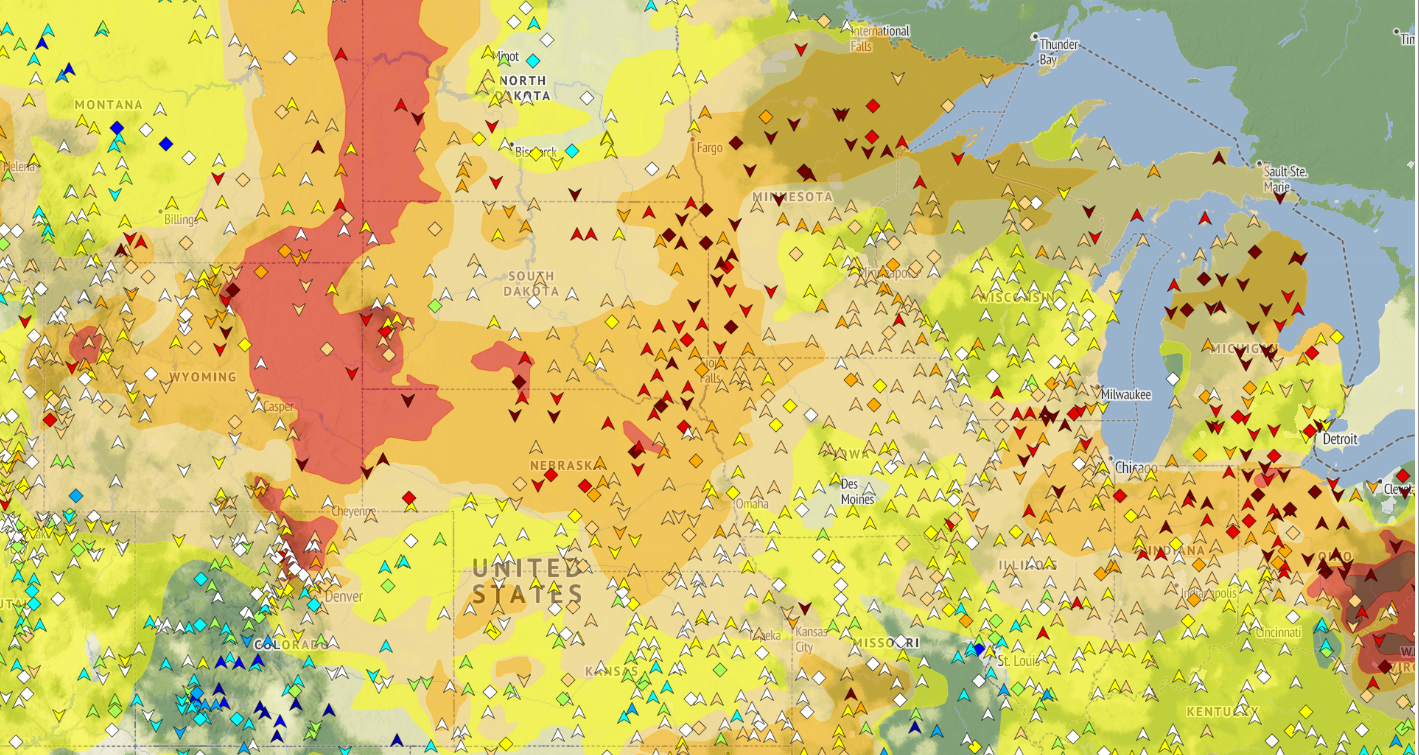
Water Deficit Trends is your resource for identifying long term changes in precipitation across the country. View precipitation trend data, alongside current drought monitor information and USGS streamflows. Select any ACIS station to analyze trends across the past six months of weekly data, and view the data in an exportable table, graph, or report.
USDM Equivalent SPI Scales

SPI and SPEI values now use a “USDM-Equivalent” color scale by default. Note that the HPRCC color scale is still available in the “Color Scale” drop down menu.
USGS Streamflow Percentile

Using the Layer panel, users can now show the 28, 14, and 7 day streamflow percentile values on the map. Clicking on a gage location will show a pop up with the streamflow over the period of interest.
Trend Analysis Panel Changes

The Trend Analysis Panel has received several new features. The graph was adjusted to provide a more consistent experience across devices and several variables were adjusted to improve usability.

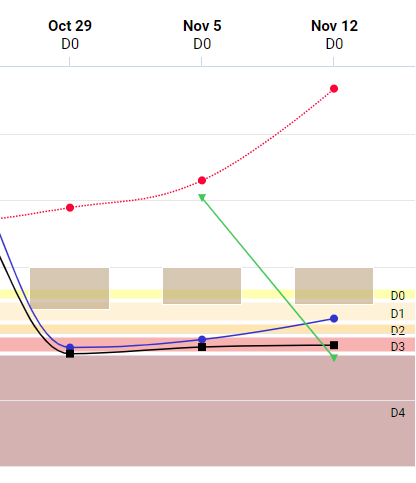
“USDM-equivalent” bands were added to the SPI scale to allow users to easily visualize impact changes over time.

Streamflow Percentile values can be plotted in the Trend Analysis Panel. Below the graph is a dropdown that displays the closest five USGS gages. Selecting the gage will display the 28, 14, or 7 day percentile values for every week in the time period. Note: We have only started collecting this data on November 5, 2024, so weeks before that date won’t be available.
New Basemap Layers


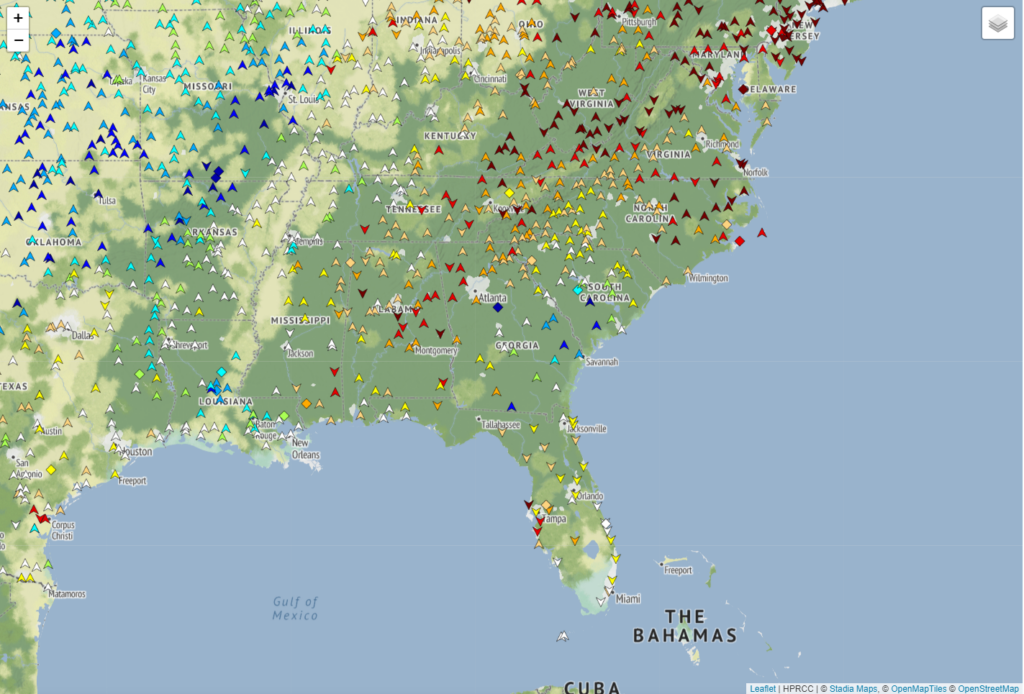
The default basemap has been changed to Open Street Map. This change was made after determining that the default map needed to have better readability for users. The basemaps from the USGS National Map are still available in the Leaflet layer control panel in the upper right corner of the map.
Some users may have noticed that the “Basic” layer became non-functional. The layer was provided by Stamen Design, whose grant for providing the maps lapsed. To continue offering their layers, we’re using the services of Stadia Maps. We will be watching our usage over the next few months to see if it is a viable long-term solution for HPRCC’s web mapping services.
Contact Our Team
If you have feedback regarding Water Deficit Trends or want to share how you are using the application, reach out to us using the Contact Us form on our website.


