CliGrow is a new agroclimate tool developed by the High Plains Regional Climate Center. It allows users to estimate crop maturity using growing degree days for any location in the lower 48 states. Estimates are available for ten different crops, with more arriving at a later date. The best part is that you can save the link to the graph and revisit your field’s up-to-date estimate at any time.
We have published a YouTube video about CliGrow here, or you can keep reading to learn more about using CliGrow.

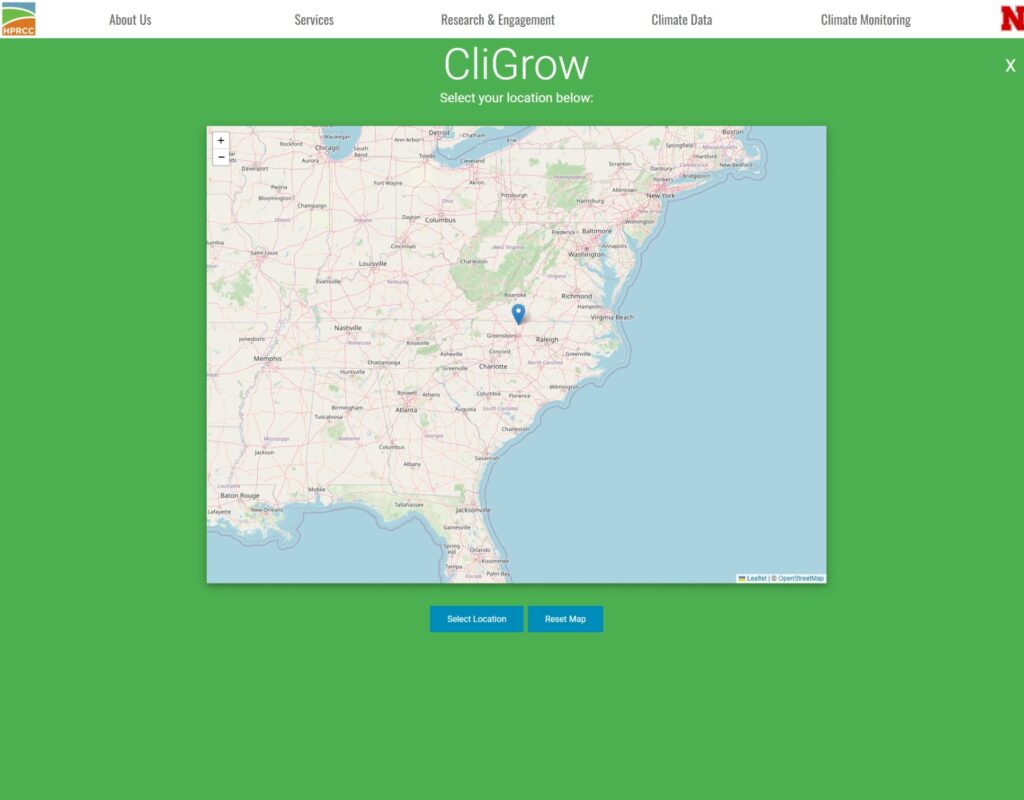
Getting started with CliGrow is easy! First, navigate to the webpage. You will first find the location selection window. From here, you can pick anywhere in the lower 48 states. For this example, we have clicked on a location in rural North Carolina.

After clicking ‘Select Location’, you will see the main interface for CliGrow. Select the planting date for your field, then the crop type. For the moment, we are going to skip talking about the Crop Maturity Settings. Specify the freezing temperature you are most concerned with, then click “Start Analysis”. The plot may take a minute to load depending on your internet connection.

After the graph is done loading, you will see something like the screenshot above. In this case, we are showing the GDD accumulation for corn at a location in rural North Carolina. The graph is displaying a lot of useful information, so lets take a closer look.
The blue bars are showing the frequency of first or last freezes based on the temperature you selected. In this case, we can see that the latest a 28 degree freeze has ever occurred was in April of 2016. Similarly, in October of 2015 this location experienced its earliest ever freeze.
The green line is showing the accumulation of Growing Degree Days starting on the planting date, and the pink line is showing the average accumulation based on data from 1991-2020. In this example, we can see that this field is estimated to be growing at a near average rate so far this year.
In the example graph, you can see two colored vertical bars. If you did not select corn, you probably see only one bar. If you left the Crop Maturity Settings blank, you won’t see any. Each vertical bar represents the range of dates when maturity has occurred, based on the Growing Degree Value provided in the Crop Maturity Settings. In the example image, the green bar is showing that the silk layer has been reached earliest on June 20, 1991, and latest on July 7, 1997. If the green line showing the current year’s accumulation has reached the maturity Growing Degree Day value, a solid vertical bar will appear at that point, representing the estimated maturity point for the planting year.
The Crop Maturity Settings allow you to specify when you think your field will mature. Most crops in CliGrow calculate a single estimated maturity date, but corn has two. Corn is also the only crop which can estimate the GDD maturity point based on a provided Days to Maturity value, though those estimates are based on work done in the central United States.
We recommend using the “Comparison Year” feature to determine a good Growing Degree Day maturity value based on the last time a crop was grown in the field. This allows you to estimate any number of maturity milestones based on your operation’s needs.
Clicking the three horizontal lines in the upper right corner of the graph allows you to save the graph image, and the Table tab shows the data being graphed.
The “Bookmark this graph” button provides a link to this graph. You can save the link in any way you like, and next time you open it, you will see an updated version of the graph.
The High Plains Regional Climate Center is excited to hear how you are using CliGrow, and welcomes any feedback you have regarding the web application. Contact Us with any questions, feedback, or suggestions you may have.
Our development team is planning on adding several new features ahead of the next growing season:


